Vitamin D: what your number actually means
What the 25(OH)D test measures, why labs and guidelines disagree on sufficient, how to read ng/mL and nmol/L, and what to ask your doctor.

In this article
Your results come back and there it is: vitamin D, 24 ng/mL, flagged low. A friend’s report prints almost the same number without a flag. One website says anything under 30 is a deficiency; another says 20 is plenty. None of them is necessarily wrong. They are working from different definitions, different units and, sometimes, different lab methods.
This guide walks through what the test measures, why experts draw the lines in different places, how to read the unit, what pushes the number up and down, and which questions are worth taking to your doctor. It is here to help you read your result, not to diagnose anything.
The test that matters: 25(OH)D
Vitamin D from sunlight, food or a supplement is not active yet. The liver first turns it into 25-hydroxyvitamin D, also called calcidiol. The kidney then converts some of that into the active hormone, 1,25-dihydroxyvitamin D, or calcitriol.1
The NIH Office of Dietary Supplements describes serum 25(OH)D as the main indicator of vitamin D status.1 It stays in the blood for weeks, with a half-life of roughly two to three weeks,2 so it reflects your recent supply rather than a single sunny afternoon.
The active form is a poor guide to your stores. The Endocrine Society’s 2011 guideline recommended against using the 1,25(OH)₂D test to judge vitamin D status,2 and Turkey’s endocrinology society notes that the active form lasts only hours in the blood.3 If your report says “25-OH vitamin D”, “25(OH)D” or “calcidiol”, you are looking at the right test. Some labs also report the D2 and D3 forms separately; guidelines refer to the total, which is the two added together.4
Why “sufficient” depends on who you ask
Here is the honest part: nobody has pinned down the exact level at which vitamin D stops being a concern. The NIH fact sheet says plainly that the blood levels associated with deficiency have not been definitively identified.1 So different expert bodies have drawn their lines in different places.
- The US National Academies (formerly the Institute of Medicine), 2011. Working from bone health, the committee concluded that a level of at least 20 ng/mL (50 nmol/L) meets the needs of at least 97.5% of people, and that the risk of deficiency rises below 12 ng/mL (30 nmol/L). It found that higher levels were not consistently linked to greater benefit.51
- The Endocrine Society, 2011. Its guideline defined deficiency as below 20 ng/mL and “insufficiency” as 21–29 ng/mL, and its recommendations aimed to keep levels above 30 ng/mL.2
- The Endocrine Society, 2024. A new panel found no clear evidence defining an optimal 25(OH)D level for preventing disease, and suggested against routine testing in people without a specific reason for it.6 In a companion paper, the society said it no longer endorses its earlier definitions of “sufficiency” (at least 30 ng/mL) and “insufficiency” (20–30 ng/mL).7
- The Society of Endocrinology and Metabolism of Turkey (TEMD), 2025. Its guideline considers 20–50 ng/mL the adequate and safe range, and links levels of 12 ng/mL or lower with a higher risk of osteomalacia, a softening of the bones.3
Your lab’s printed reference range may follow any of these, or a convention of its own. That is how the same 24 ng/mL can be flagged low on a report whose range starts at 30, and sit unflagged on one that uses 20. The flag tells you where you fall against that lab’s line. It is not a verdict on your health.
The top end matters too. The NIH consumer fact sheet says levels above 50 ng/mL (125 nmol/L) are too high and might cause health problems, and it describes toxicity symptoms at very high levels, above 150 ng/mL (375 nmol/L).8
There is one more layer: the measurement itself. Laboratories use different methods, and variability between 25(OH)D assays is widely recognized. External quality checks have found it persisting both within and between the most common testing platforms, and researchers set up a Vitamin D Standardization Program to bring methods into line.41 In practice, when you compare results over time, it helps to know which lab produced each one.
ng/mL or nmol/L: reading the unit
Vitamin D is reported in two units, and they differ by a factor of 2.5. The NIH gives the conversion as 1 nmol/L = 0.4 ng/mL.8 So:
- ng/mL × 2.5 = nmol/L
- nmol/L ÷ 2.5 = ng/mL
The difference is not cosmetic. A result of 50 sits right on the National Academies’ sufficiency line if the unit is nmol/L, and at the edge of “too high” if it is ng/mL. Before you compare a number with anything you read online, or with an older report, check which unit sits next to it.
| ng/mL | nmol/L | What this level often marks |
|---|---|---|
| 12 | 30 | National Academies: deficiency risk rises below this1 |
| 20 | 50 | National Academies: sufficient for most people at or above this1 |
| 30 | 75 | Endocrine Society 2011 “sufficiency” line, no longer endorsed since 20247 |
| 50 | 125 | NIH: levels above this are considered too high8 |
| 150 | 375 | NIH: toxicity symptoms described above this8 |
Supplement labels add a third pair of units. Doses are given in micrograms (mcg) or international units (IU), and 1 mcg equals 40 IU, so 15 mcg is 600 IU.8 That conversion is for doses, not blood levels, so it never applies to your lab result.
What moves your number
For most people, the main source of vitamin D is the skin, which makes it when UVB light from the sun reaches it.2 Food contributes less: few foods contain much vitamin D naturally, fatty fish and fish liver oils among the exceptions.1 That is why the level moves with so many everyday things.
Season and latitude. The lower the sun sits in the sky, the less UVB reaches you. The Endocrine Society’s 2011 guideline notes that above roughly 33° latitude, north or south, the skin makes very little vitamin D, or none, for most of the winter.2 Real-world data show the swing: in a study of 85,892 adults tested at a Turkish university hospital, average levels were highest in summer and lowest in winter.9

Time of day, clouds and glass. Time of day, length of day and cloud cover all change how much UVB you get.1 Glass matters too: sitting in the sun behind a window does not let the skin make vitamin D.3
Sunscreen and skin tone. Sunscreen with SPF 30 cuts the skin’s vitamin D production by more than 95%, and people with naturally darker skin need roughly three to five times longer in the sun to make the same amount.2 None of this is a reason to skip sun protection. The National Academies set their intake recommendations assuming minimal sun exposure, partly because of skin cancer risk.5
Age. The skin’s ability to make vitamin D falls with age, and the NIH lists older adults among the groups more likely to have low levels.21
Body weight. Levels tend to be lower at a BMI above 30. Vitamin D is fat-soluble, and body fat holds on to it, which leaves less circulating in the blood.2 The NIH also lists people who have had gastric bypass surgery as a group at risk.1
Absorption. Conditions that limit fat absorption, such as celiac disease or inflammatory bowel disease, can lower levels. Vitamin D is fat-soluble, and fat in the gut helps it get absorbed.13
Medications. Some medicines can interact with vitamin D or change its levels. The NIH mentions orlistat, statins, steroids and thiazide diuretics, and the Turkish guideline lists some anti-seizure drugs and glucocorticoids.13
Supplements and fortified foods. These raise the level. The NIH notes that vitamin D3 raises 25(OH)D more than D2 does and keeps it up for longer.1 How much a given amount moves the number differs a lot from person to person, with age, body weight, body fat and absorption among the reasons.3
One result is a snapshot; the trend is the story
Put those factors together and a single value starts to look like what it is: one moment. Because 25(OH)D reflects the past few weeks, and because sunlight changes through the year, the same person can land on different sides of a cutoff in March and in September. Seasonal swings can be large. In one Turkish study, from the city of Bursa, deficiency was found in 77.5% of men tested between March and May, compared with 32.9% of men tested between September and November.3
| Reading | Value (ng/mL) |
|---|---|
| Mar 2024 | 16 |
| Sep 2024 | 29 |
| Mar 2025 | 19 |
| Sep 2025 | 33 |
| Mar 2026 | 22 |
Read one at a time, those results would tell three different stories: low, fine, low again. Read together, they show a steady seasonal rhythm, with the spring lows edging upward.
A single vitamin D result is a snapshot. Two or three, taken in different seasons, start to tell you something.
A few details make a series easier to read, for you and for your doctor:
- The date, so you can see the season.
- The lab and the unit, since methods and units differ.
- What you were taking at the time, including multivitamins and fortified foods.
- Anything that changed, such as a winter spent somewhere sunnier, a big change in weight, or a new medication.
Testing more often is not the goal. The Endocrine Society’s 2024 guideline suggests against routine 25(OH)D testing in generally healthy people,6 and the Turkish guideline likewise does not recommend screening the healthy general population, reserving testing for people at higher risk.3 When a recheck makes sense is a decision for you and your doctor.
Questions to bring to your doctor
Ask your doctor
Worth asking at your next appointment
- Which cutoff are you using to read my result, and why is that the right one for me?
- Does the lab’s printed range match the guideline you go by?
- Given my age, health history and medications, is this test useful for me, and when would a recheck tell us something new?
- If you suggest a supplement: which form, how much, for how long, and will we recheck?
- Could any condition or medication I have be affecting my level?
- With everything I already take, including multivitamins and fortified foods, am I staying under the upper limit?
About that upper limit: for adults, the tolerable upper intake level is 100 mcg (4,000 IU) a day, counting food, drinks and supplements together.8 The NIH notes that a clinician may recommend more than this for a limited time to correct a low level.8 That is a supervised decision, not a target to chase on your own. Vitamin D toxicity almost always comes from taking too much in supplements.1
Keeping your results in one place
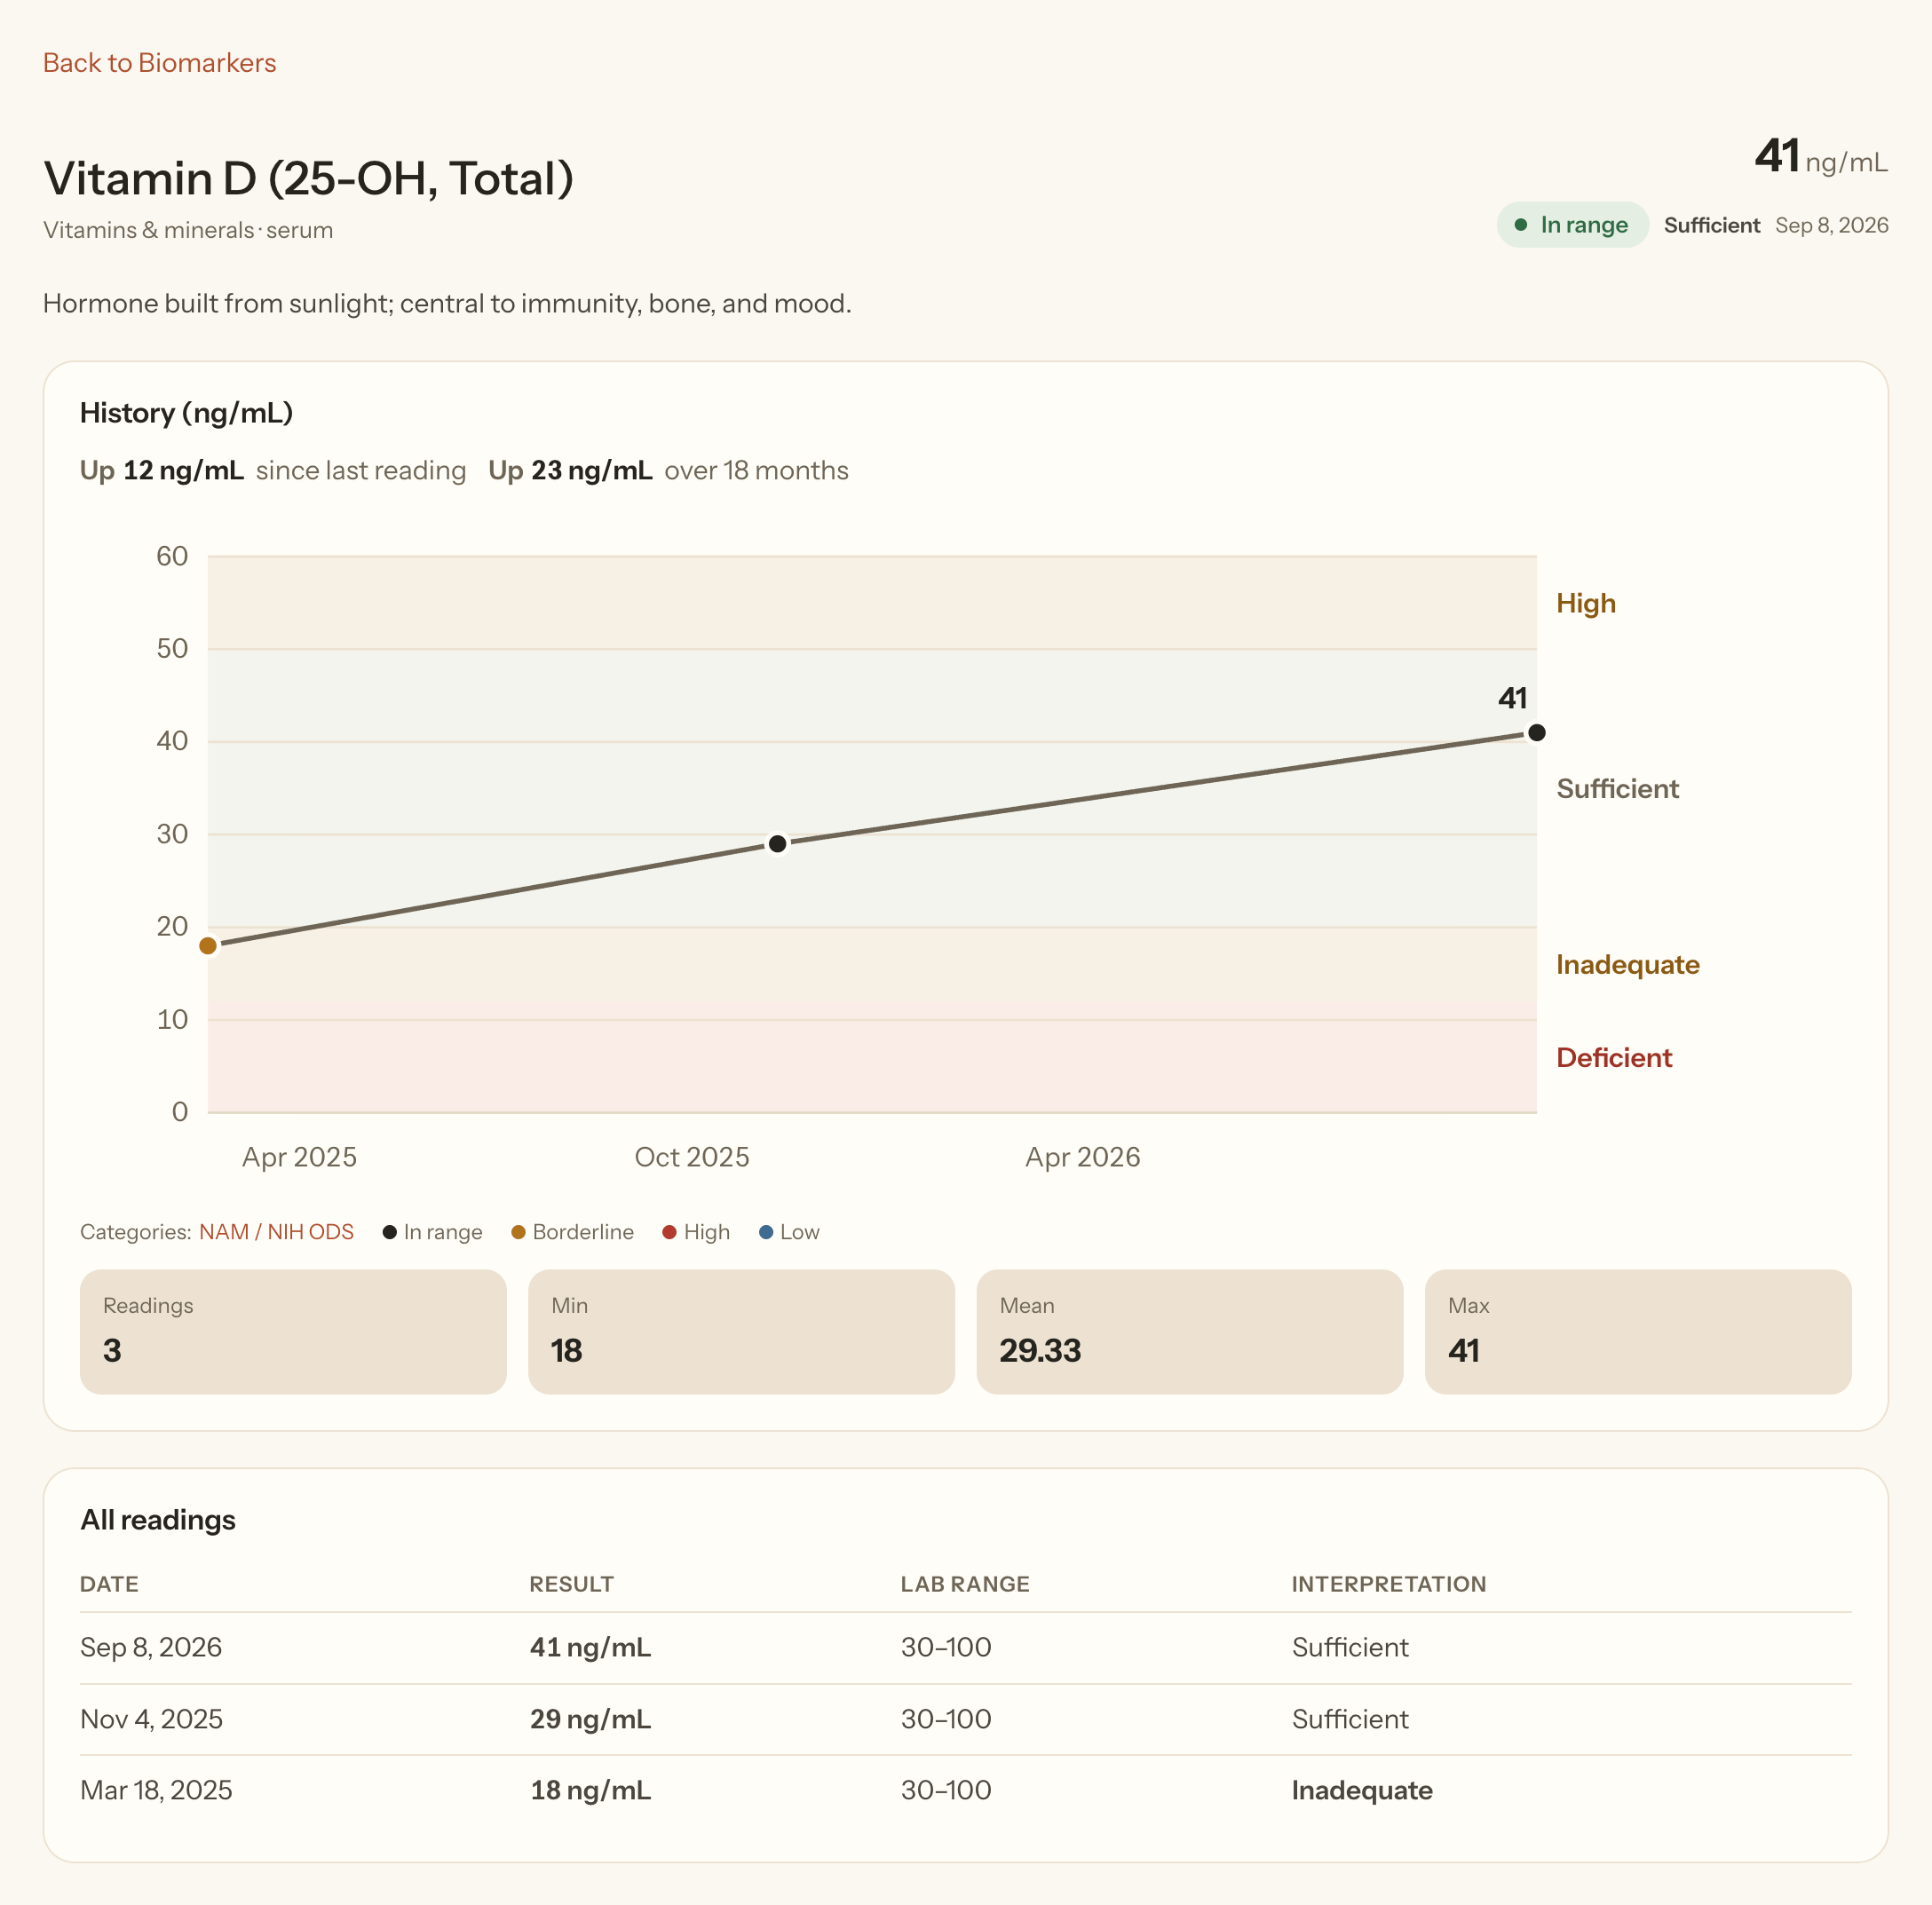
Reading vitamin D over time is often harder than it should be, for practical reasons: the results sit in different PDFs, from different labs, sometimes in different units. That is the problem we built Romy for.
You upload a lab report PDF and Romy pulls out the results with their dates. It puts every report on one chart, converted into the unit your most recent lab uses, and keeps the range your lab printed next to each result. For vitamin D, it also labels each value against the National Academies categories, with a link to the source, so you can see both lines at once. It does not diagnose anything or suggest doses, and it is not a substitute for your clinician.
References
-
National Institutes of Health, Office of Dietary Supplements. “Vitamin D — Fact Sheet for Health Professionals.” Updated June 27, 2025. https://ods.od.nih.gov/factsheets/VitaminD-HealthProfessional/ ↩
-
Holick MF, Binkley NC, Bischoff-Ferrari HA, et al. “Evaluation, Treatment, and Prevention of Vitamin D Deficiency: an Endocrine Society Clinical Practice Guideline.” J Clin Endocrinol Metab. 2011;96(7):1911–1930. https://academic.oup.com/jcem/article/96/7/1911/2833671 ↩
-
Türkiye Endokrinoloji ve Metabolizma Derneği (Society of Endocrinology and Metabolism of Turkey). “Osteoporoz ve Metabolik Kemik Hastalıkları Tanı ve Tedavi Kılavuzu.” 17th updated edition, April 2025. Chapter 13, “Vitamin D Eksikliği.” https://file.temd.org.tr/Uploads/publications/guides/documents/OSTEPOROZ_nisan2025.pdf ↩
-
Sempos CT, Binkley N. “25-Hydroxyvitamin D assay standardisation and vitamin D guidelines paralysis.” Public Health Nutr. 2020;23(7):1153–1164. https://pmc.ncbi.nlm.nih.gov/articles/PMC7167380/ ↩
-
Ross AC, Manson JE, Abrams SA, et al. “The 2011 report on dietary reference intakes for calcium and vitamin D from the Institute of Medicine: what clinicians need to know.” J Clin Endocrinol Metab. 2011;96(1):53–58. https://pubmed.ncbi.nlm.nih.gov/21118827/ ↩
-
Demay MB, Pittas AG, Bikle DD, et al. “Vitamin D for the Prevention of Disease: An Endocrine Society Clinical Practice Guideline.” J Clin Endocrinol Metab. 2024;109(8):1907–1947. https://pubmed.ncbi.nlm.nih.gov/38828931/ ↩
-
McCartney CR, McDonnell ME, Corrigan MD, Lash RW. “Vitamin D Insufficiency and Epistemic Humility: An Endocrine Society Guideline Communication.” J Clin Endocrinol Metab. 2024;109(8):1948–1954. https://pubmed.ncbi.nlm.nih.gov/38828961/ ↩
-
National Institutes of Health, Office of Dietary Supplements. “Vitamin D — Fact Sheet for Consumers.” Updated November 8, 2022. https://ods.od.nih.gov/factsheets/VitaminD-Consumer/ ↩
-
Samanci R. “How deficient are we? A retrospective analysis of vitamin D status in 85,892 Turkish adults.” BMC Public Health. 2026;26(1):856. https://pubmed.ncbi.nlm.nih.gov/41652560/ ↩