How to read your blood test report
Reference ranges, H and L flags, units and trends: a calm, cited guide to what your lab report says, what it does not, and what to ask your doctor.

In this article
The PDF arrives before the appointment does. It is a page or three of test names, numbers, units and small letters in the margin, and a few of those letters say H or L. This guide explains how a typical report is put together, what the numbers are compared against, and why a flag is the start of a conversation with your doctor rather than the end of one.
Nothing here is a diagnosis. Lab results are interpreted in context: your history, your symptoms, your medicines and your earlier results. That is your clinician’s job; this article is meant to help you arrive with better questions.
The anatomy of a lab report
Layouts vary, but almost every report has the same five columns in some order.
- Test name. Often abbreviated: Hb or HGB for hemoglobin, ALT for alanine aminotransferase, TSH for thyroid stimulating hormone.
- Result. The number the lab measured in your sample. Some tests return words instead, such as “negative” or “trace”.
- Unit. What the number is counted in: grams per decilitre, millimoles per litre, units per litre. The same result looks completely different in another unit.
- Reference range. The low and high limits this lab uses to describe typical results. Sometimes it is a single limit, such as ”< 200”.
- Flag. A marker that the result sits outside the reference range. Common forms are H and L, an asterisk, or a < or > sign.
Here is what that looks like in practice. The report below is invented for this article; the values and ranges are illustrative only, and your own lab’s ranges will differ.
| Test | Result | Flag | Unit | Reference range |
|---|---|---|---|---|
| Hemoglobin | 11.8 | L | g/dL | 12.0–15.5 |
| White blood cells | 6.4 | 10³/µL | 4.0–10.0 | |
| Platelets | 262 | 10³/µL | 150–400 | |
| Glucose (fasting) | 94 | mg/dL | 70–99 | |
| Creatinine | 0.82 | mg/dL | 0.59–1.04 | |
| ALT | 41 | H | U/L | 7–35 |
| Ferritin | 18 | ng/mL | 15–150 | |
| TSH | 2.1 | mIU/L | 0.40–4.00 |
Invented example report. Not real patient data.
Two flags, six results without one. The rest of this article is about what those two letters do and do not tell you, and why the unflagged ferritin near the bottom of its range might be worth a question too.
What a reference range actually is
A reference range is the set of numbers that forms the high and low ends of results considered normal, and it is based on test results from large groups of healthy people.1 The convention behind most of them is statistical. A lab tests a group of healthy people, at least 120 in the standard approach, sets aside the lowest 2.5% and the highest 2.5% of results, and calls the central 95% the reference range.23
That convention has a built-in consequence. By definition, 5% of healthy people will have a result outside the range on any given test.24 The effect compounds when many tests are run at once.
64%
of healthy people would get at least one out-of-range result on a panel of 20 tests, from the arithmetic of the 95% convention alone
Doles et al., Journal of the American Board of Family Medicine, 2025.2
That figure assumes the tests are independent, which real panels only partly are, but the point stands: a flag somewhere on a long report is common, even in people who are well.2 MedlinePlus, the US National Library of Medicine’s patient site, puts it plainly: it is common for healthy people to sometimes have results outside the reference range.1
The range also depends on who was in the reference group. Age, sex, pregnancy and the type of sample all shift what is typical.4 A hemoglobin level that is normal for an adult woman would be read as anemia in a newborn, and the lower limit for hemoglobin differs between adult women and adult men.2
Why the range changes from lab to lab
Labs use different equipment and different testing methods, so each lab has to set or verify its own reference ranges.41 In practice many labs adopt ranges from manufacturers or textbooks, and the CLSI guideline on reference intervals (C28-A3) recommends that a lab validate a borrowed range before adopting it.23 Only three tests, cholesterol, creatinine and HbA1c, have been standardised internationally; for most others, results and ranges vary with the method.2
So the fair comparison for your result is the range printed on the same report, not a number from a website or another lab.
Units, and how the same result can look different
Countries and labs report in different units. Cholesterol is often printed in mg/dL in some countries and mmol/L in others, and the same threshold appears as 5 mmol/L in one and roughly 190 mg/dL in the other.5 HbA1c is reported either as a percentage or in mmol/mol; an HbA1c of 6.0% is the same measurement as 42 mmol/mol.6 Hemoglobin can appear as 12.0 g/dL or 120 g/L.
When two reports seem to disagree wildly, check the unit column before anything else. A result that “jumped” from 5 to 190 has usually just changed units.
Flags are not diagnoses
A flag is a simple rule: the result is above or below this lab’s limits. It gives the same letter to a result a hair outside the range and to one far outside it.
Laboratory specialists have been cautious about flags for this reason. A review in the journal of the International Federation of Clinical Chemistry notes that reference limits carry uncertainty, so results close to either limit, inside or outside, sit in a grey zone that is hard to classify. The authors point out that flags such as H, L and * make a report quicker to scan but can pull attention away from borderline results that may matter more, and can frighten patients who do not know that the range only includes 95% of healthy people.7
The same review draws a distinction worth knowing: reference ranges describe healthy people, while decision limits are cut-offs set for a specific clinical question, such as the level at which a guideline suggests further action. Decision limits depend on the decision being made and change as evidence changes.7 Cholesterol is a good example. A European consensus recommends that lipid results be flagged against desirable concentration cut-points rather than a population range, so a lipid report may show a single limit such as ”< 200” rather than a low-to-high range.5
So a flag answers one narrow question: is this outside the lab’s range? Whether it matters depends on how far outside, what else is on the report, how you feel and what the result was last time.
Caution
Do not change medication based on one result
Never start, stop or adjust a prescribed medicine or dose because of a single lab value, flagged or not. Results can be affected by timing, preparation and lab method, and your doctor may want to repeat the test before acting. If a result worries you, call the clinic that ordered it.
It works the other way too. A result inside the range is not proof that all is well. A review on biological variation gives the example of kidney function: a person can sit within the population range yet already have lost significant function.8 The range tells you where most healthy people fall, not where you usually fall.
One result is a snapshot; a trend is a story
Every measurement combines three things: your true level, the normal fluctuation of your body from day to day, and the small imprecision of the lab method. Each person’s values tend to vary around their own set point.8 That is why laboratory medicine compares a result in three different ways: against a reference range, against a clinical decision limit, or against the person’s own previous results.87
For follow-up, the last of these is often the most useful. Laboratory scientists use a measure called the reference change value to judge whether the difference between two results from the same person is larger than normal biological and analytical variation would explain.9 You do not need to calculate it. The practical lessons are simpler:
- A small change between two results may be noise. A steady drift across several results is more informative.
- A value can move meaningfully while staying inside the range the whole time.
- Where possible, repeat tests at the same lab. Results for the same sample can differ noticeably between laboratories, even for standardised tests, while repeat testing within one lab is much tighter.2
The chart below is illustrative, not real data. Every value is inside the range until the last one, yet the direction was visible several reports earlier.
| Reading | Value (g/dL) |
|---|---|
| Jan 2024 | 13.6 |
| Jul 2024 | 13.2 |
| Jan 2025 | 12.7 |
| Jul 2025 | 12.2 |
| Jan 2026 | 11.8 |
And here is the flagged ALT from the invented report, drawn against its range. It is just outside the upper limit. On its own, that is a reason to ask a question, not a conclusion.
What can move a result on the day
Some results are sensitive to what happened before the sample was taken. MedlinePlus lists eating and drinking certain foods, taking certain medicines or supplements, hard exercise before the test and having a menstrual period.1 A few specifics:
- Fasting. Some tests ask for it; you may be told to fast for 9 to 12 hours before a cholesterol test.10 A joint European consensus of cardiology and laboratory societies found that ordinary meals change lipid results only slightly and recommends non-fasting lipid profiles for routine use.5 Follow the instructions your own lab or clinician gives you, and note on the day whether you fasted.
- Activity and meals. A muscle enzyme, creatine kinase, rises with normal physical activity, and alkaline phosphatase can be higher after a meal.2
- Time of day. Cortisol is normally highest in the morning and much lower by late afternoon, which is why the timing of that test matters.11
- Supplements. Biotin above recommended amounts can cause false results in some lab tests, including some hormone tests such as thyroid tests.12 Mention every supplement you take, including hair, skin and nail products.
Common panels, briefly
These short descriptions are for orientation only. What a result means for you depends on the whole picture.
Complete blood count (CBC). Counts red blood cells, white blood cells and platelets, and measures hemoglobin, hematocrit and the average size of red cells (MCV). An abnormal value does not always mean a condition that needs care; diet, activity, medicines, menstruation and hydration can all affect it.13
Metabolic panel (BMP or CMP). A comprehensive metabolic panel measures 14 substances covering glucose, electrolytes, kidney markers such as creatinine and BUN, liver enzymes and proteins. A basic panel contains 8 of those 14.14
Lipid panel. Measures total cholesterol, LDL, HDL and triglycerides.10 As noted above, many lipid limits are decision limits rather than population ranges.5
HbA1c. Reflects your average blood glucose over the past two to three months. Conditions that affect red blood cells, such as anemia, and kidney or liver disease can make it less accurate.15
Ferritin. A protein that stores iron, used to judge the body’s iron stores. It can be raised by inflammation, infection, liver disease and other conditions, not only by excess iron, so a “normal” ferritin is read alongside other results.16
TSH. Thyroid stimulating hormone, made by the pituitary gland. When thyroid hormone is low, the pituitary makes more TSH to push the thyroid harder, so a high TSH can point to an underactive thyroid and a low TSH to an overactive one.17
Questions to bring to your doctor

These questions work for almost any result.
- Which of these results matter most for me, and which are within normal variation?
- How far outside the range is this flagged result, and does that distance matter?
- How does this compare with my previous results? Is there a trend?
- Could anything on the day have affected it: fasting, exercise, timing, a recent illness, a medicine or a supplement?
- Should the test be repeated, and if so, when and at which lab?
- Is this range a population reference range or a clinical decision limit?
- What would change your view of this result, and what should I watch for in the meantime?
Ask your doctor
Bring the whole record
If you can, bring earlier reports as well as the new one, a list of every medicine and supplement you take, and a note of anything unusual before the test. Your doctor reads a result against all of that, and it saves time for the questions that matter.
How Romy reads a lab report
Romy is a personal health memory, built for the problem this article describes: results scattered across PDFs from different labs, in different units, with nothing that shows the trend. Here is what it does with a report today.
You upload the PDF from your lab. Romy reads each result with its value, its unit and the reference range the lab printed next to it. Before anything is saved, it shows you what it found in a review table: each biomarker, its value, the lab’s reference range and a status. Results already on file from an earlier upload are marked as duplicates, and anything Romy cannot match with confidence is set aside for you to decide on, rather than guessed. Nothing becomes part of your record until you press Save.
After you save, each marker gets its own chart across every report you have uploaded. Values from different reports are converted into one unit so they line up, and the band behind the line is the reference range printed by your lab. For a few markers where clinical guidelines set decision limits, such as HbA1c, lipids and vitamin D, Romy shows the guideline’s bands instead and names the source. You can then ask Romy’s coach about a result in your own words, and it answers from your own history.
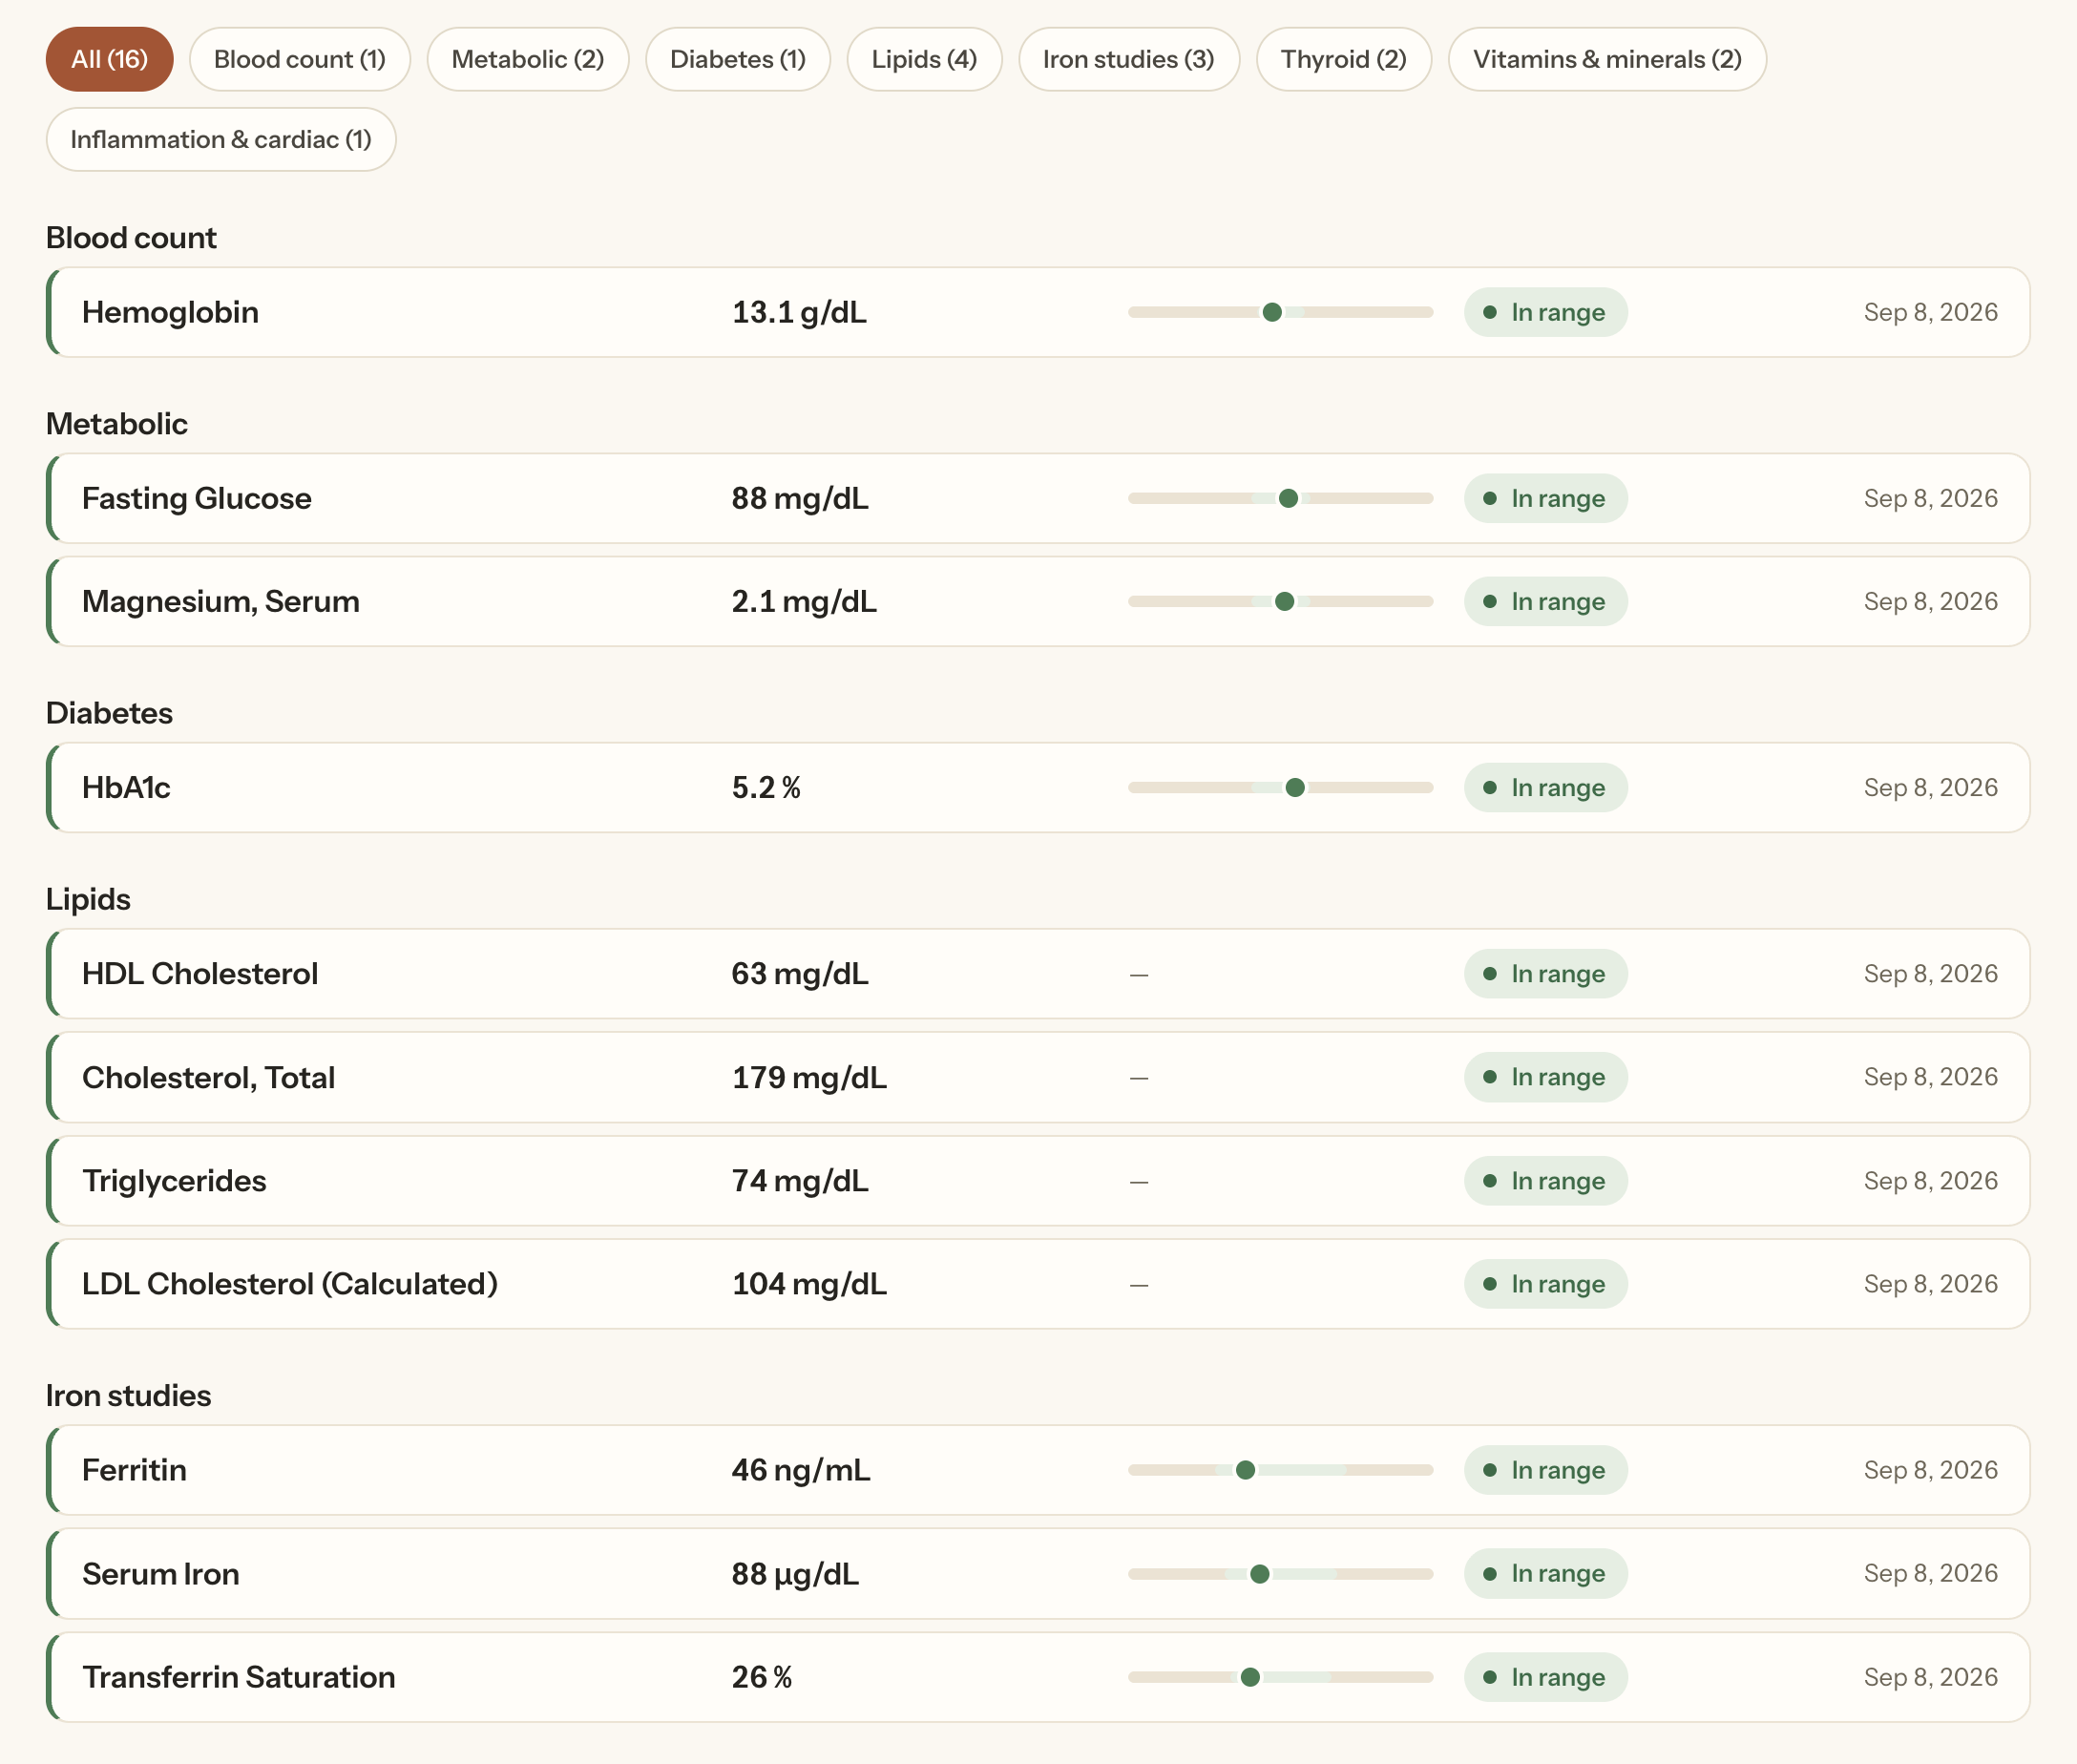
Romy helps you understand and organise your health information. It is not a medical service, it does not diagnose, and it does not replace your clinician. What it can do is make sure that when you sit down with your doctor, the whole story is in one place.
References
-
MedlinePlus, U.S. National Library of Medicine. “How to Understand Your Lab Results.” https://medlineplus.gov/lab-tests/how-to-understand-your-lab-results/ ↩
-
Doles N, Mon MY, Shaikh A, et al. “Interpretating Normal Values and Reference Ranges for Laboratory Tests.” Journal of the American Board of Family Medicine, 2025. https://pmc.ncbi.nlm.nih.gov/articles/PMC12096374/ ↩
-
Ozarda Y. “Reference intervals: current status, recent developments and future considerations.” Biochemia Medica, 2016. https://biochemia-medica.com/en/journal/26/1/10.11613/BM.2016.001/fullArticle ↩
-
Testing.com. “Reference Ranges and What They Mean.” 2021. https://www.testing.com/articles/laboratory-test-reference-ranges/ ↩
-
Nordestgaard BG, Langsted A, Mora S, et al. “Fasting is not routinely required for determination of a lipid profile.” Joint consensus statement of the European Atherosclerosis Society and the European Federation of Clinical Chemistry and Laboratory Medicine. European Heart Journal, 2016. https://pubmed.ncbi.nlm.nih.gov/27122601/ ↩
-
NGSP. “IFCC Standardization: IFCC and NGSP.” https://ngsp.org/ifccngsp.asp ↩
-
Ceriotti F, Henny J. “‘Are my Laboratory Results Normal?’ Considerations to be Made Concerning Reference Intervals and Decision Limits.” EJIFCC, 2008. https://pmc.ncbi.nlm.nih.gov/articles/PMC4975205/ ↩
-
Badrick T. “Biological variation: Understanding why it is so important?” Practical Laboratory Medicine, 2021. https://pmc.ncbi.nlm.nih.gov/articles/PMC7809190/ ↩
-
Fraser CG. “Reference change values.” Clinical Chemistry and Laboratory Medicine, 2012. https://pubmed.ncbi.nlm.nih.gov/21958344/ ↩
-
MedlinePlus, U.S. National Library of Medicine. “Cholesterol Levels.” https://medlineplus.gov/lab-tests/cholesterol-levels/ ↩
-
MedlinePlus, U.S. National Library of Medicine. “Cortisol Test.” https://medlineplus.gov/lab-tests/cortisol-test/ ↩
-
NIH Office of Dietary Supplements. “Biotin: Fact Sheet for Consumers.” 2021. https://ods.od.nih.gov/factsheets/Biotin-Consumer/ ↩
-
MedlinePlus, U.S. National Library of Medicine. “Complete Blood Count (CBC).” https://medlineplus.gov/lab-tests/complete-blood-count-cbc/ ↩
-
MedlinePlus, U.S. National Library of Medicine. “Comprehensive Metabolic Panel (CMP).” https://medlineplus.gov/lab-tests/comprehensive-metabolic-panel-cmp/ ↩
-
MedlinePlus, U.S. National Library of Medicine. “Hemoglobin A1C (HbA1c) Test.” https://medlineplus.gov/lab-tests/hemoglobin-a1c-hba1c-test/ ↩
-
MedlinePlus, U.S. National Library of Medicine. “Ferritin Blood Test.” https://medlineplus.gov/lab-tests/ferritin-blood-test/ ↩
-
MedlinePlus, U.S. National Library of Medicine. “TSH (Thyroid Stimulating Hormone) Test.” https://medlineplus.gov/lab-tests/tsh-thyroid-stimulating-hormone-test/ ↩