HRV, explained without the hype
What heart-rate variability really measures, why Whoop and Oura report different numbers, and why your own baseline matters more than any chart of normal.

In this article
Open any sleep or recovery app and HRV is usually near the top, in milliseconds, often coloured green or red. It has become shorthand for “how recovered am I?” That shorthand is useful, but it hides a lot. This guide walks through what the number measures, why two devices disagree, and how to read it without either ignoring it or worrying about every dip.
What HRV actually measures
Your heart does not tick like a metronome. Even at rest, the gap between two beats might be 950 milliseconds, then 1,010, then 980. Heart-rate variability is simply a measure of that fluctuation in the time between adjacent heartbeats.1
The variation comes mostly from the autonomic nervous system, the part of your nervous system that runs without conscious effort. Its two branches pull in opposite directions: the sympathetic side speeds the heart up, and the parasympathetic side, carried largely by the vagus nerve, slows it down. At rest the vagal influence prevails, and beat-to-beat changes in heart period depend largely on it.2 Because each vagal signal acts quickly and wears off fast, it produces the quick back-and-forth that HRV picks up.2
That is why you will often read that “high HRV means strong parasympathetic tone”. It is a reasonable starting point, but it is a simplification. HRV reflects modulation, how much the heart rate is being varied, rather than a direct reading of vagal tone. Changes in breathing alone can markedly shift measures such as RMSSD without any real change in vagal tone.1 And higher is not automatically better: some heart rhythm problems, such as atrial fibrillation, produce very irregular beats that read as high variability.1
A fairer summary: HRV is a window onto how flexibly your body is adjusting your heart rate, measured under particular conditions. Change the conditions and the number changes too.
RMSSD and SDNN: two ways to count the wobble
There is no single “HRV”. It is a family of calculations over the same list of beat-to-beat intervals. The 1996 international standards from the European Society of Cardiology and the North American Society of Pacing and Electrophysiology describe many of them.2 The two you will meet most often are these:
| RMSSD | SDNN | |
|---|---|---|
| What it calculates | The root mean square of successive differences between beats | The standard deviation of all normal beat-to-beat intervals |
| What it mostly reflects | Short-term, beat-to-beat changes, the primary time-domain estimate of vagally mediated HRV1 | Overall variability; both sympathetic and parasympathetic activity contribute1 |
| How recording length affects it | Less affected by slow drifts over the recording1 | Grows with longer recordings, so values from different durations should not be compared2 |
| Where you will see it | Whoop and Oura report HRV as RMSSD3 | Common in clinical 24-hour ECG studies; also used in some research on wearables4 |
The last row matters in practice. The standards are blunt about SDNN in particular:
It is inappropriate to compare SDNN measures obtained from recordings of different durations.
The same logic extends, more gently, to RMSSD. A number taken over five minutes of deep sleep and a number averaged over a whole night are related, but they are not the same measurement.
Why your Whoop and Oura numbers don’t match
People who wear two devices, or switch from one to another, often notice their HRV “changed” overnight. Usually nothing about them changed. The measuring did.
Both companies measure HRV during sleep, when you are still and the signal is least disturbed by daily life, and both report it as RMSSD.56 Where they differ is which part of the night feeds the number:
| Whoop | Oura | |
|---|---|---|
| When | Only during sleep5 | Only during sleep6 |
| Metric | RMSSD5 | RMSSD3 |
| Which part of the night | Whoop says it measures overnight during the deepest period of sleep;5 researchers quote Whoop describing a dynamic average weighted towards the last slow-wave (deep) sleep stage of the night3 | Five-minute samples taken throughout the night; the average HRV shown is the mean of all of them6 |
| What you see | One nightly HRV value, used in the Recovery score5 | Average HRV for the night, plus the night’s maximum6 |
A reading weighted towards your last stretch of deep sleep and an average across the whole night can land at different values for the same heart on the same night, because HRV naturally shifts across sleep stages and across the night. On top of the windowing, each company uses its own algorithms to turn a wrist or finger optical signal into beat timings, and the two are not equally close to a chest ECG.
One 2025 study had 13 healthy adults sleep with an ECG reference and several wearables at the same time, across 536 nights. Against the ECG, Oura’s HRV agreed very closely (Lin’s concordance of 0.97 to 0.99, depending on generation) and Whoop’s agreed acceptably, if less closely (0.94).3 Those are good results for consumer devices. They still mean two devices on the same person will not print identical numbers.
The practical upshot is simple: compare a device with itself. If you switch devices, give the new one a few weeks to establish its own baseline before reading much into the level.

Your baseline beats any chart of “normal”
It is tempting to ask what a “good” HRV is. The honest answer is that healthy people differ enormously.
19–75 ms
Range of average resting RMSSD across short-term studies of healthy adults pooled in one large review
That range comes from a review of 44 studies with 21,438 healthy adults, summarised by Shaffer and Ginsberg.1 Oura’s own guide puts typical values anywhere from under 20 to over 200 milliseconds.6 Age, sex, fitness and health status all shift where a person sits, and HRV measures decline with age.16
So a friend’s HRV of 90 says nothing about whether your 45 is fine. What is informative is your number compared with your usual range, measured the same way. Both device makers say this in their own documentation.56 Sports scientists found something similar in a small study of 10 runners: changes in a single day’s HRV barely tracked changes in fitness over nine weeks, while the same measure averaged over a week tracked them closely.7
In practice that means three habits:
- Look at weekly averages, not single mornings.
- Know your band. After a few weeks, you will see the range you normally move within. Single nights outside it are common.
- Watch for direction and duration. A dip that recovers in a day or two is ordinary. A slide that keeps going for a week or more deserves a closer look at what else changed.
| Reading | Value (ms) |
|---|---|
| Day 1 | 56 |
| Day 2 | 58 |
| Day 3 | 54 |
| Day 4 | 57 |
| Day 5 | 55 |
| Day 6 | 59 |
| Day 7 | 57 |
| Day 8 | 42 |
| Day 9 | 51 |
| Day 10 | 56 |
| Day 11 | 58 |
| Day 12 | 55 |
| Day 13 | 57 |
| Day 14 | 60 |
| Day 15 | 56 |
| Day 16 | 52 |
| Day 17 | 49 |
| Day 18 | 46 |
| Day 19 | 44 |
| Day 20 | 45 |
| Day 21 | 43 |
What tends to move HRV (and how fast)
Many things nudge HRV. A few have solid evidence behind them and are worth knowing, because they explain most of the dips people see.
Alcohol. In a study of 4,098 Finnish employees who recorded beat-to-beat heart data in everyday life, alcohol was dose-dependently associated with less parasympathetic and more sympathetic regulation during the first hours of sleep. The effect showed up even at low intake, and regular exercise or younger age did not protect against it.8 If you want to see one cause-and-effect pattern in your own data, this is often the clearest.
4,098
People in the real-world study linking evening alcohol, in a dose-dependent way, to lower overnight recovery
Short or disrupted sleep. A 2025 meta-analysis of 11 studies with 549 participants found that sleep deprivation significantly lowered RMSSD, suggesting a shift away from vagal activity.9
Illness. Your body’s response to an infection often shows up in HRV. In a study of health-care workers wearing Apple Watches, HRV patterns shifted around a COVID-19 diagnosis, including in the days before a positive test.4 Oura lists illness alongside stress and overtraining as common reasons for a low reading.6
Training load. Hard sessions lower HRV temporarily, and that is part of how training works.5 What matters is whether it comes back. A weekly average that keeps falling during a heavy block is a signal to look at recovery, not a verdict.7
Psychological stress. A review of 37 studies found that HRV changed in response to stress in most of them, most often in the direction of lower parasympathetic activity.10
Timing and conditions. Because both devices read HRV from sleep, anything that changes your night changes the window being measured: a later bedtime, a shorter night, a late heavy meal or workout. Breathing rate, posture and recent activity all affect HRV readings too, which is why measuring under similar conditions matters.1
Note
One night is weather, weeks are climate
A single low reading after a late dinner and two glasses of wine is expected, and it usually says more about last night than about your health. Changes you can explain, and that reverse within a few days, rarely need further attention.
What HRV can’t tell you, and when to talk to a doctor
HRV has a long history in cardiology. Measured with a 24-hour ECG, reduced HRV after a heart attack predicts higher risk, and it is used to assess nerve damage in diabetes.2 Those findings come from clinical recordings in specific patient groups. They do not turn a consumer wearable into a diagnostic test.
Some honest limits:
- HRV doesn’t diagnose anything. It can’t tell you why it changed. A drop from a cold, a hard week at work and a new medication can look identical.
- “Higher” is not the goal in itself. As above, irregular rhythms can inflate HRV.1 A sudden, unexplained jump deserves as much curiosity as a drop.
- It is sensitive to measurement. Missing data, a loose band or a restless night all affect the number. Oura notes that everyday daytime events are exactly why it measures only during sleep.6
Ask your doctor
When a change is worth mentioning to a doctor
Bring it up with a doctor if your HRV stays clearly below your usual range for more than a week or two without an obvious reason, or if a change in HRV or resting heart rate comes with symptoms: palpitations that keep coming back or last more than a few minutes, unusual breathlessness, dizziness or unexplained tiredness. If you have a known heart condition, or heart problems run in your family, mention palpitations even if you feel well. Chest pain, shortness of breath or fainting with palpitations needs urgent medical help, not a trend chart.11
Bring the data with you. A few weeks of your trend, with notes on sleep, illness and medication changes, is far more useful to a clinician than a single screenshot.
Seeing HRV next to the rest of your health
The hardest part of reading HRV is context. The number sits in one app, your blood tests in a PDF, and what happened that week lives only in your memory.
That is the gap Romy is built for. When you connect Whoop or Oura, Romy syncs your sleep, recovery and HRV automatically and keeps them in the same record as your lab results, supplements, training and illnesses. When you ask a question, the coach answers from that whole record, so “why has my HRV been low this week?” can start from your own nights, your notes and your last blood test rather than from a blank page. It won’t diagnose anything, but it can help you notice a pattern and put it into words for your doctor.
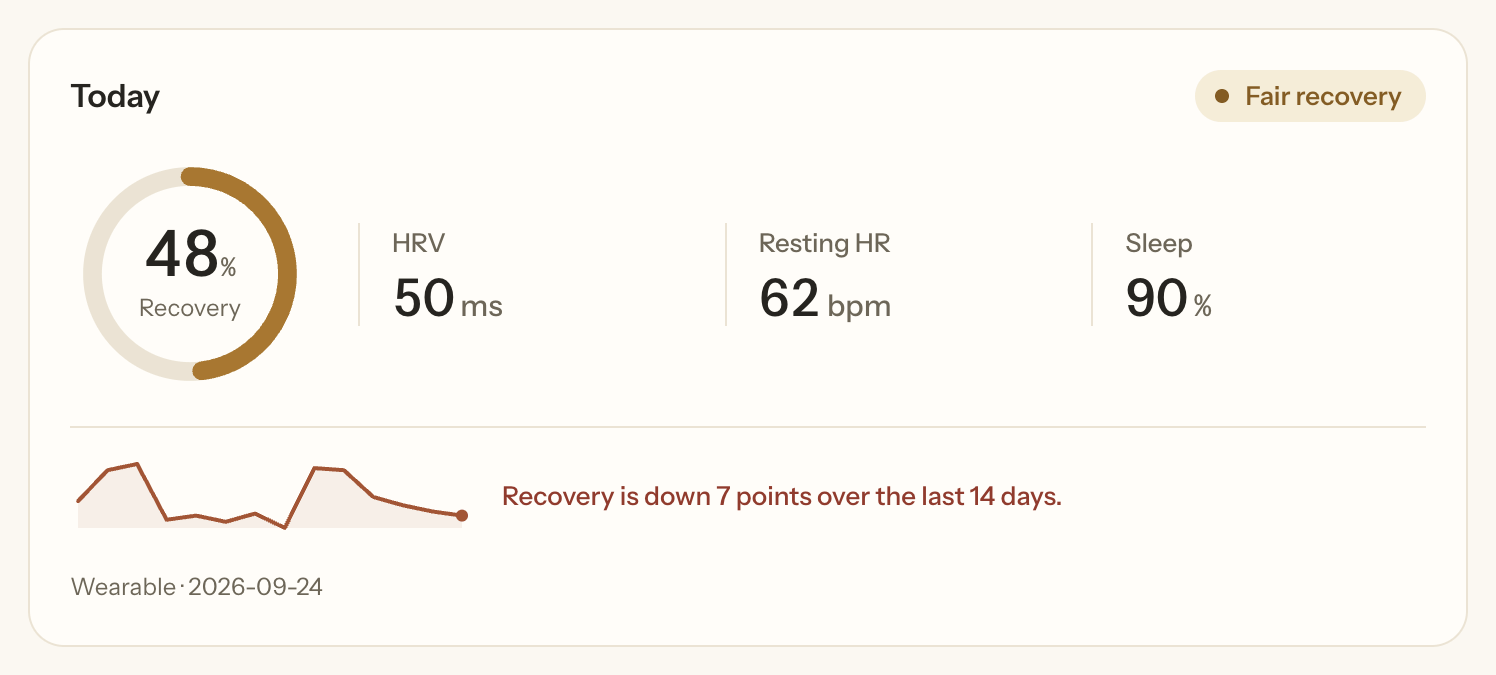
HRV is worth watching, calmly. Learn your own range, look at weeks rather than mornings, and take a lasting change as a prompt for a conversation, not a conclusion.
References
-
Shaffer F, Ginsberg JP. “An Overview of Heart Rate Variability Metrics and Norms.” Frontiers in Public Health, 2017;5:258. https://www.frontiersin.org/journals/public-health/articles/10.3389/fpubh.2017.00258/full ↩
-
Task Force of the European Society of Cardiology and the North American Society of Pacing and Electrophysiology. “Heart Rate Variability: Standards of Measurement, Physiological Interpretation, and Clinical Use.” Circulation, 1996;93(5):1043–1065. https://www.ahajournals.org/doi/10.1161/01.CIR.93.5.1043 ↩
-
Dial MB, Hollander ME, Vatne EA, Emerson AM, Edwards NA, Hagen JA. “Validation of nocturnal resting heart rate and heart rate variability in consumer wearables.” Physiological Reports, 2025;13:e70527. https://physoc.onlinelibrary.wiley.com/doi/10.14814/phy2.70527 ↩
-
Hirten RP, Danieletto M, Tomalin L, et al. “Use of Physiological Data From a Wearable Device to Identify SARS-CoV-2 Infection and Symptoms and Predict COVID-19 Diagnosis: Observational Study.” Journal of Medical Internet Research, 2021;23(2):e26107. https://www.jmir.org/2021/2/e26107/ ↩
-
WHOOP Support. “Heart Rate Variability (HRV) Insights & WHOOP Metrics.” Accessed 24 September 2026. https://support.whoop.com/s/article/Heart-Rate-Variability-HRV-Insights-WHOOP-Metrics?language=en_US ↩
-
Oura Member Care. “Heart Rate Variability.” Last updated 14 July 2026, accessed 24 September 2026. https://support.ouraring.com/hc/en-us/articles/360025441974-Heart-Rate-Variability ↩
-
Plews DJ, Laursen PB, Kilding AE, Buchheit M. “Evaluating training adaptation with heart-rate measures: a methodological comparison.” International Journal of Sports Physiology and Performance, 2013;8(6):688–691. https://pubmed.ncbi.nlm.nih.gov/23479420/ ↩
-
Pietilä J, Helander E, Korhonen I, Myllymäki T, Kujala UM, Lindholm H. “Acute Effect of Alcohol Intake on Cardiovascular Autonomic Regulation During the First Hours of Sleep in a Large Real-World Sample of Finnish Employees: Observational Study.” JMIR Mental Health, 2018;5(1):e23. https://mental.jmir.org/2018/1/e23/ ↩
-
Zhang S, Niu X, Ma J, Wei X, Zhang J, Du W. “Effects of sleep deprivation on heart rate variability: a systematic review and meta-analysis.” Frontiers in Neurology, 2025;16:1556784. https://www.frontiersin.org/journals/neurology/articles/10.3389/fneur.2025.1556784/full ↩
-
Kim HG, Cheon EJ, Bai DS, Lee YH, Koo BH. “Stress and Heart Rate Variability: A Meta-Analysis and Review of the Literature.” Psychiatry Investigation, 2018;15(3):235–245. https://pmc.ncbi.nlm.nih.gov/articles/PMC5900369/ ↩
-
NHS. “Heart palpitations.” Page last reviewed 17 March 2026. https://www.nhs.uk/conditions/heart-palpitations/ ↩